The coach of the Dutch sailing team has asked TU-researcher Dr Sukanta Basu to produce detailed wind maps of the complex Sagami bay near Tokyo.

The wind is rather fickle on the olympic sailing arena near Tokyo. (Foto: Wikicommons)
The sailing crews of TeamNL are used to the wide and open waters of the North Sea near Scheveningen or the IJsselmeer near Medemblik. But sailing coach Jaap Zielhuis knows that Olympic sailing near Tokyo requires another approach. “What works well on the IJsselmeer, won’t work in Japan”, Zielhuis comments. “It’s very difficult to forecast minute-by-minute what the wind there is going to do.” So how will the sailing teams learn to master the Sagami Bay. How will they crack the Tokyo code?
With applied science and a supercomputer, one could say. Dr Sukanta Basu, who teaches atmospheric turbulence at the CEGS Faculty, has been working with the Dutch sailing team for more than three years. The collaboration is an activity of the TU Delft sports engineering institute. In the past, Basu has produced wind maps for every hour that the teams were out on the water practicing near Scheveningen. But producing wind maps for the Olympic sailing arena is a different task altogether.
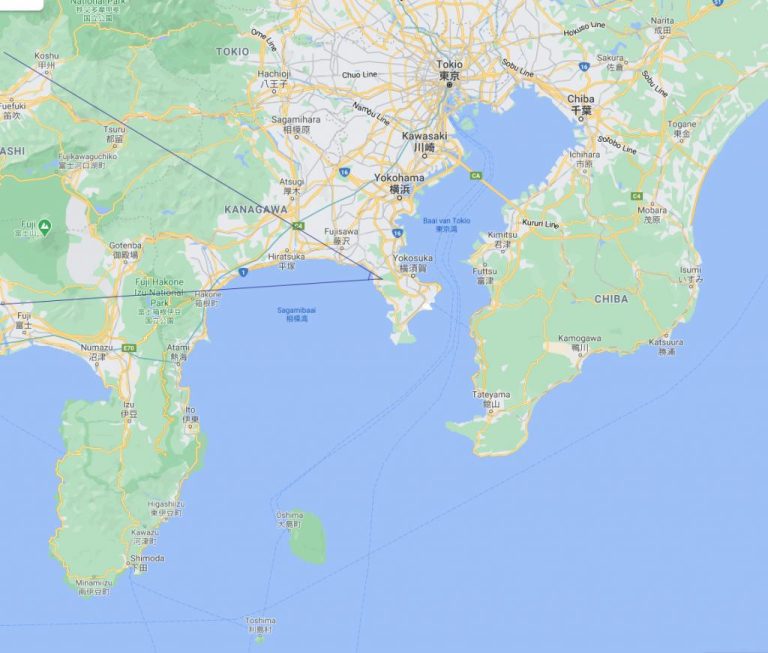 Map of the Sagami Bay. In blue the standing point and the angle of the camera for the main photo. (Image: Google Maps)
In contrast to the Dutch open waters, the Sagami bay, south of Tokyo, has challenging features such as the adjacent Mount Fuji, towering 3,777 metres over the bay. In contrast, the water is deep which causes relatively large temperature differences. And in the middle of it, there is Oshima island with a mountain peak at 700 metres. “Oshima island is known to produce meandering wind patterns in its wake”, says Dr Basu.
Basu uses the open-source weather research and forecasting model (WRF) that he will run on the SURFsara supercomputer with hundreds of CPUs. “It’s a complex meteorological model that I have tuned for the Sagami bay area”, Basu explains. He feeds the model with latest weather data to produce a high-resolution 4D information of tomorrow’s wind conditions (3D spatial plus time). The wind fields are forecast for every 10-minute intervals.
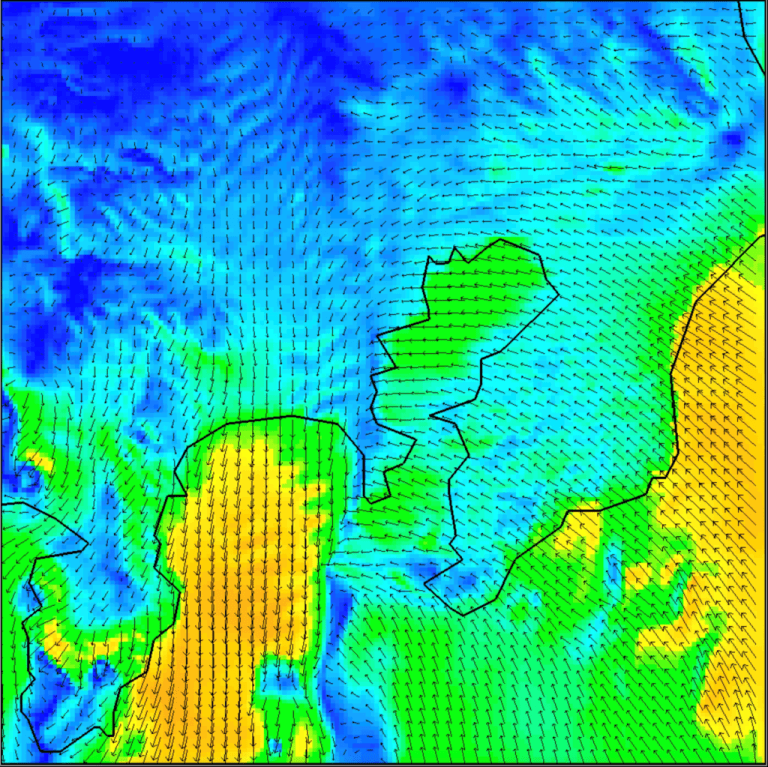
Wind map of the bay. (Image: Sukanta Basu)
A wind map of the 170 x 170 km area illustrates the complexity of the local wind patterns. It shows a hard northern wind of 15-20 m/s over the Sagami bay. But just 15 kilometres west of Oshima island, the wind blows from the opposite south-east (about 10 m/s). And in-between there is hardly any wind. Photos of the bay show the same patchy wind patterns.
At the moment Basu is still testing the model for the Tokyo area. He is post-processing the WRF forecasts with machine learning tools to further finetune the model.
During the games, Basu will produce detailed maps with wind direction, speed and wind pattern classifications for every 10 minutes of the race. The sailors will be shown contour maps with the predicted wind speed patterns just before they go out.
Sailing coach Zielhuis values the information from the weather model. “It allows sailors to understand the weather conditions better. The information thus supports their creativity and insights during the race.”
Do you have a question or comment about this article?
j.w.wassink@tudelft.nl
Comments are closed.