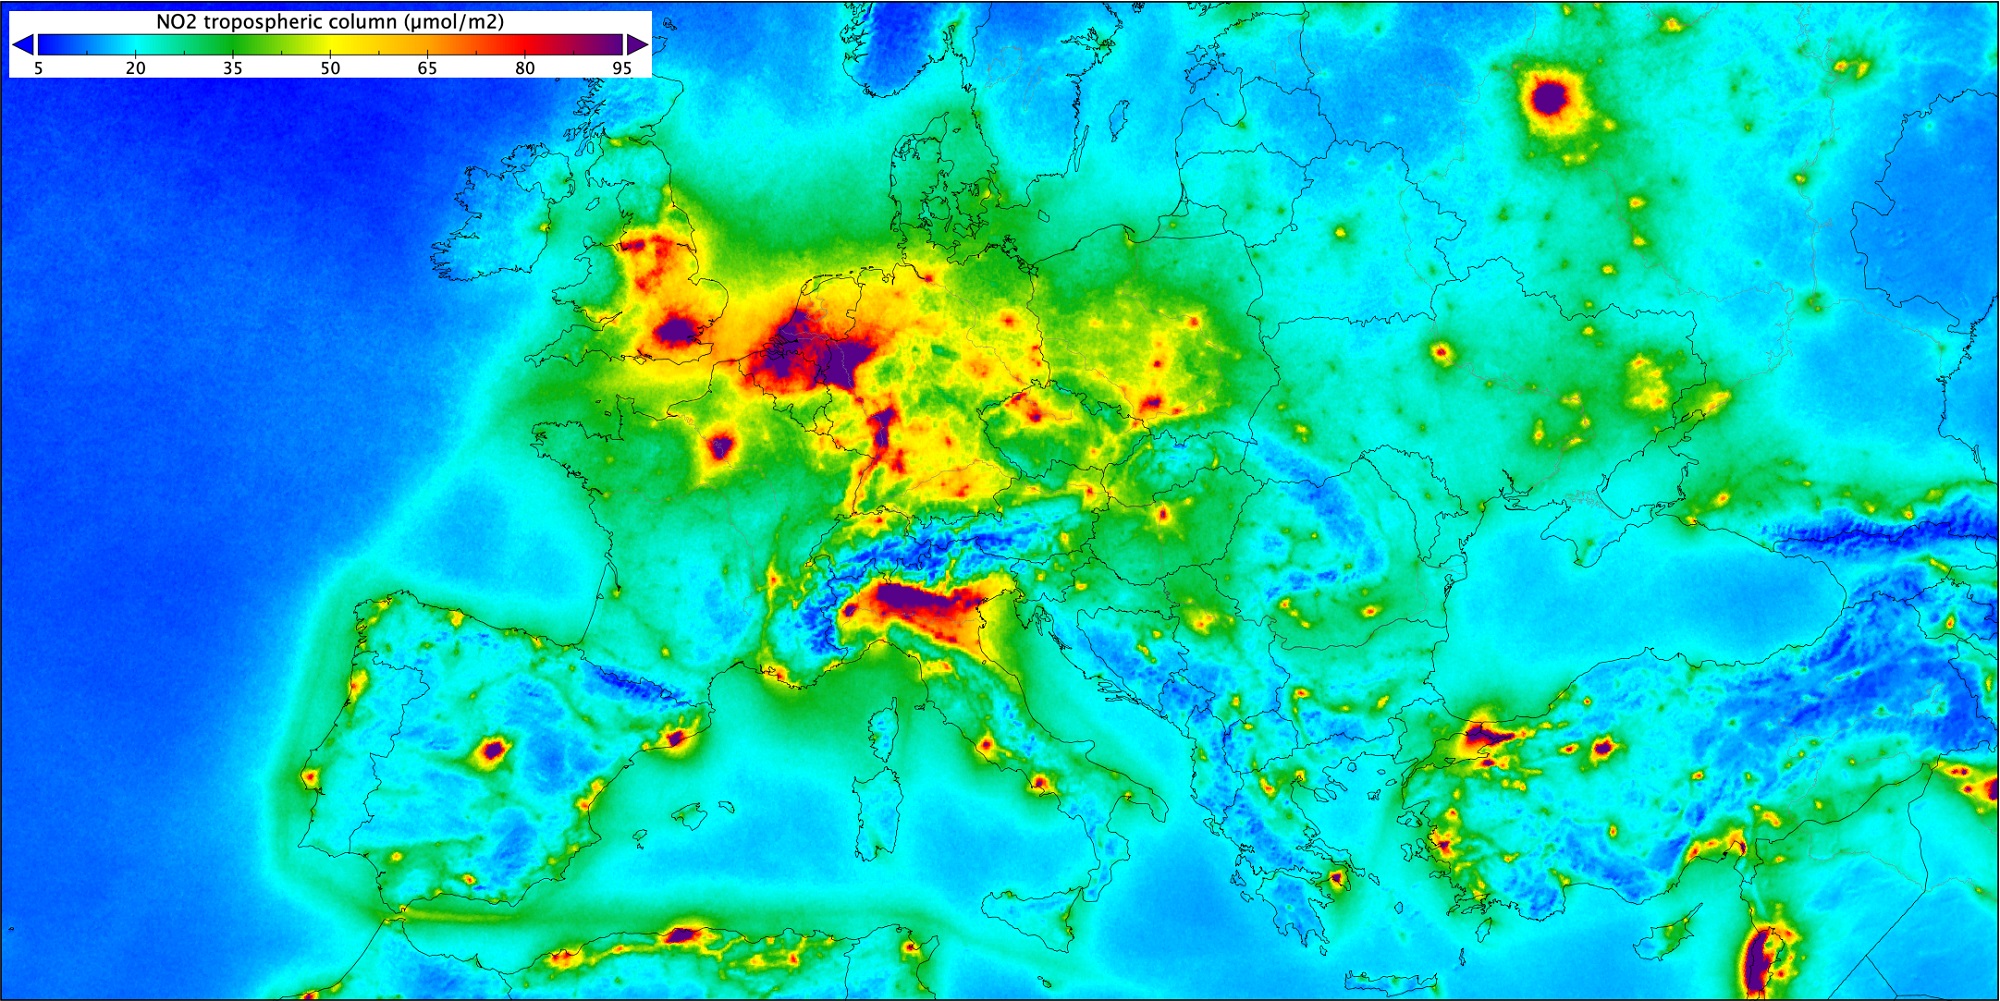
Air pollution in India is rising, and it is plateauing in China, says Pieternel Levelt, the initiator of Tropomi, the most precise tool ever to measure pollution from space.
“We can clearly see that the measures China has taken in order to diminish nitrogen dioxide emissions are starting to pay off,” confirms Pieternel Levelt, head of satellite observation at the Netherlands meteorological institute KNMI and researcher at TU Delft’s atmospheric remote sensing group.
“It looks as if India is becoming the next largest air polluter. Levels of carbon monoxide, aerosols, sulphur dioxide, nitrogen dioxide and formaldehyde are rising sharply.”
Preliminary results also show that the Netherlands has one of the highest concentrations of nitrogen dioxide in Europe.
Tropomi stands for Tropospheric Monitoring Instrument. Pieternel Levelt initiated the work on this device, and KNMI hosts the Principal Investigator team of Tropomi. The instrument measures the chemical composition of the troposphere, the lowest layer in the atmosphere up to 10 and 15 km altitude. The instrument measures the sunlight absorbed and scattered by the atmosphere. These measurements are compared to the direct measurement of sunlight done once a day.
The Tropomi instrument was designed and built as a commission of the Dutch government and the European Space Agency (ESA).
It is possible for everyone to follow the live data stream
This instrument was launched on 13 October 2017, incorporated in the European satellite Sentinel-5 Precursor, and has since been orbiting the Earth collecting data at an altitude of 824 km. On 7 November 2017, the first measurements were received. These measurements are more accurate than anything that has preceded them.
Levelt added, “Tropomi had a spatial resolution of 3.5 by 7 km; since August 6 this has even been improved to 3.5 x 5.5 km, which makes it possible to identify different sources of air pollution. In a city like Rotterdam, for example, we can distinguish between the emissions from the port area and those produced by the city centre. In that context it will be interesting to see whether or not measures to combat pollution are making a difference. The resolution is powerful enough to monitor the air pollution plumes from major cities around the world.”
Data have been pouring in since December 2017. And as of this summer, it is possible for everyone to follow the live data stream on the website of the Tropomi project.
“In the coming years we expect that more and more applications with the Tropomi data will be developed, taking advantage of the exclusive high spatial resolution, like emission calculations using inverse modelling techniques, and improvements in the air quality forecast.”
Do you have a question or comment about this article?
tomas.vandijk@tudelft.nl


Comments are closed.