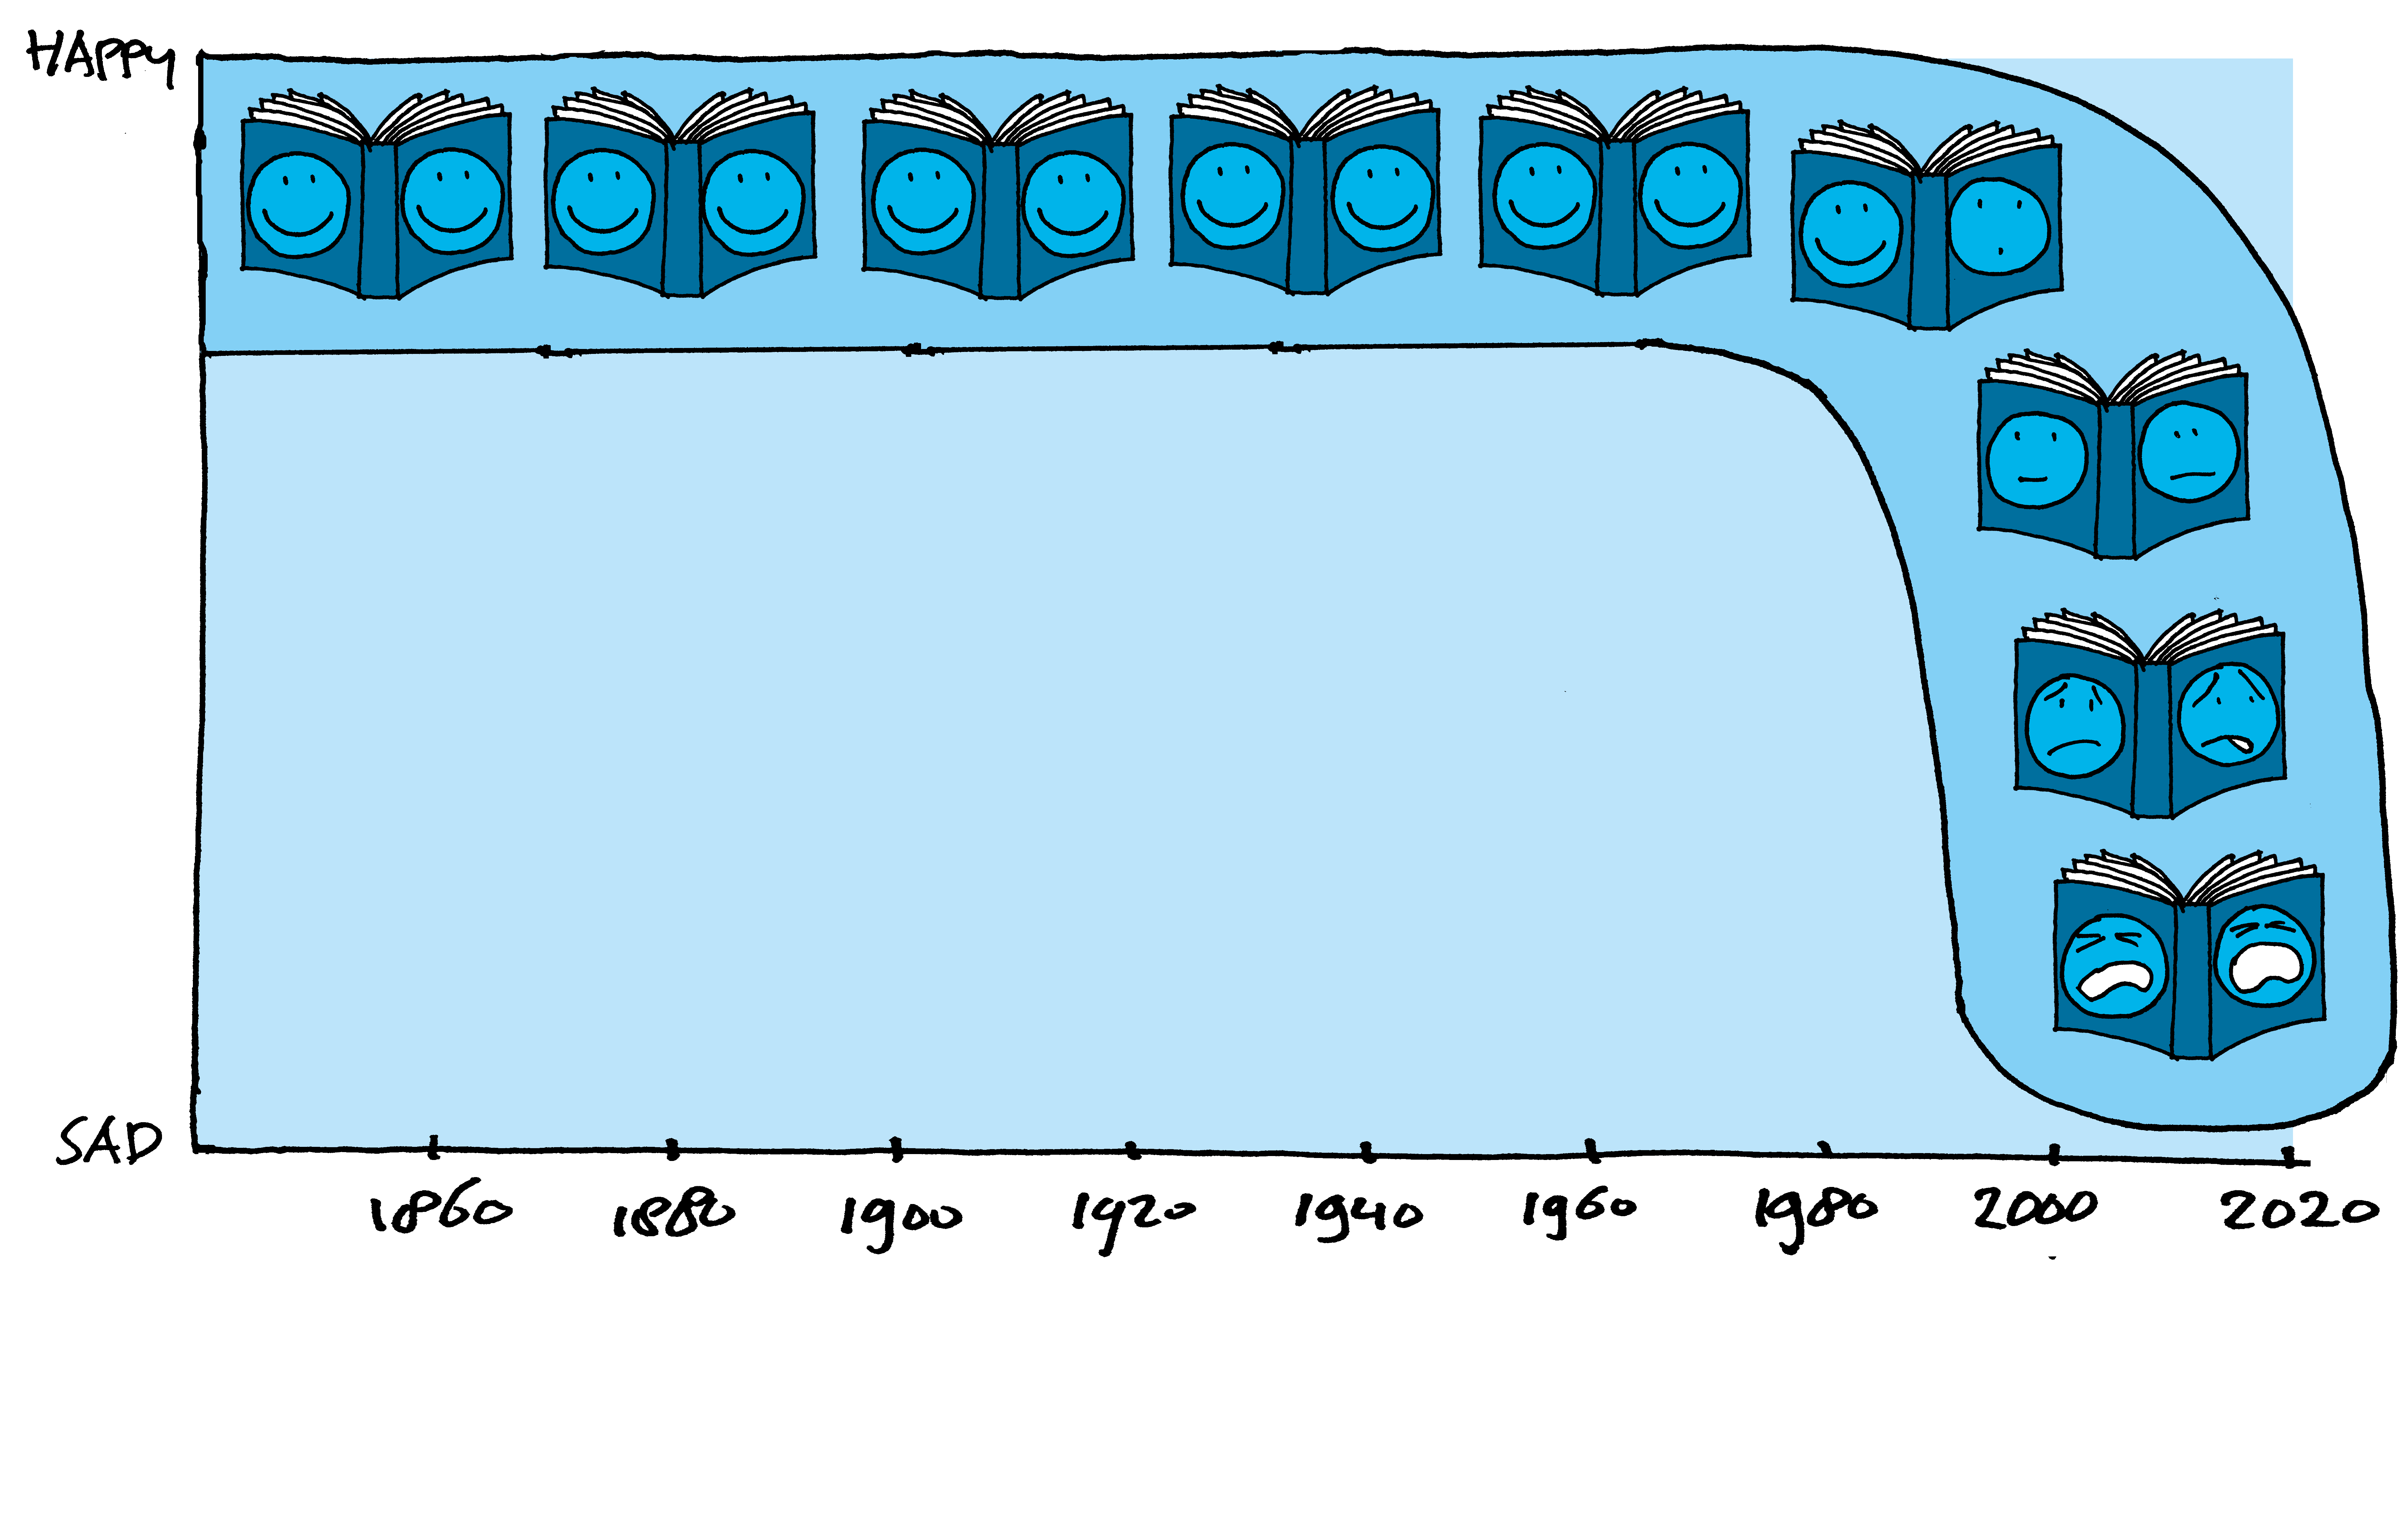
Scientists find a sharp uptick in the language of depression. “We might be talking each other into the doldrums,” says TU Delft mathematician Marijn ten Thij.
(Illustration: Auke Herrema)
You probably know the hockey stick graph from climate science: a long flat line with a sharp upturn. The graph, published in 1998, shows that Earth’s temperature was relatively stable for 500 years, only to suddenly spike in the 20th century. Well, now social science may have its own hockey stick graph as well, and it is not a cheerful one either.
Scientists from the US and TU Delft found evidence of a sharp increase since 1980 in what they call ‘maladaptive patterns of thinking’. These are thought patterns that are often linked to depression.
The researchers had a computer programme crunch a collection of over 14 million English (US), German, and Spanish books published between 1855 and 2019 and uploaded to Google Books. They set out to find out if entire civilisations can become more or less depressed over time.
‘It is possible to capture the zeitgeist by looking at word usage’
The study controlled for syntax changes during that time. Still, the leap from the use of words in literature to a measure of the mood of society seems to be a big one. Can you really distil all this information from books, some of which are novels with fictional characters? Mathematician Marijn ten Thij of the Applied Probability Section (Electrical Engineering, Mathematics & Computer Science Faculty) and one of the authors is indeed convinced that “it is possible to capture the zeitgeist by looking at word usage”.
The researchers looked for short sequences of one to five words that act as tell-tale signs of black and white thinking, self-blame, magnification of negative aspects or jumping to conclusions, for example. Take for instance sentences like: ‘Nobody ever cares about me’ or ‘I always have bad luck’.
Eight million tweets
“We’ve looked at these cognitive distortion schemata before on social media,” says Ten Thij. “We found that people with self-reported depression expressed this kinds of distorted thinking more often on Twitter. We analysed eight million tweets from over 8,000 Twitter accounts.”
The results of the study, which Ten Thij performed with data scientists and psychologists from Indiana University in the US, were published in Nature Human Behavior earlier this year. Their subsequent study was published last month in Proceedings of the National Academy of Sciences and is entitled Historical language records reveal a surge of cognitive distortions in recent decades.
What the scientists found in all three languages was a distinctive ‘“hockey stick” pattern’ — a sharp uptick in the language of depression after 1980. The only other (much smaller) spikes visible on the timelines occur in English language books during the Gilded Age (at the end of the 19th century when the US was industrialising at a fast pace) and books published in German immediately after World War II.
What is the explanation for the sharp rise since 1980? Could it be due to economic crashes, wealth concentration, problems on the housing markets, climate change? There was much misery prior to 1980, so the reason behind the sharp rise remains elusive. “Perhaps we talk – or write – each other into the doldrums,” says Ten Thij.
Do you have a question or comment about this article?
tomas.vandijk@tudelft.nl


Comments are closed.