TU Delft researcher Ricardo Reinoso performs measurements on heavy rain and thunderstorms with radar technology. His work should lead to much more accurate measurements.
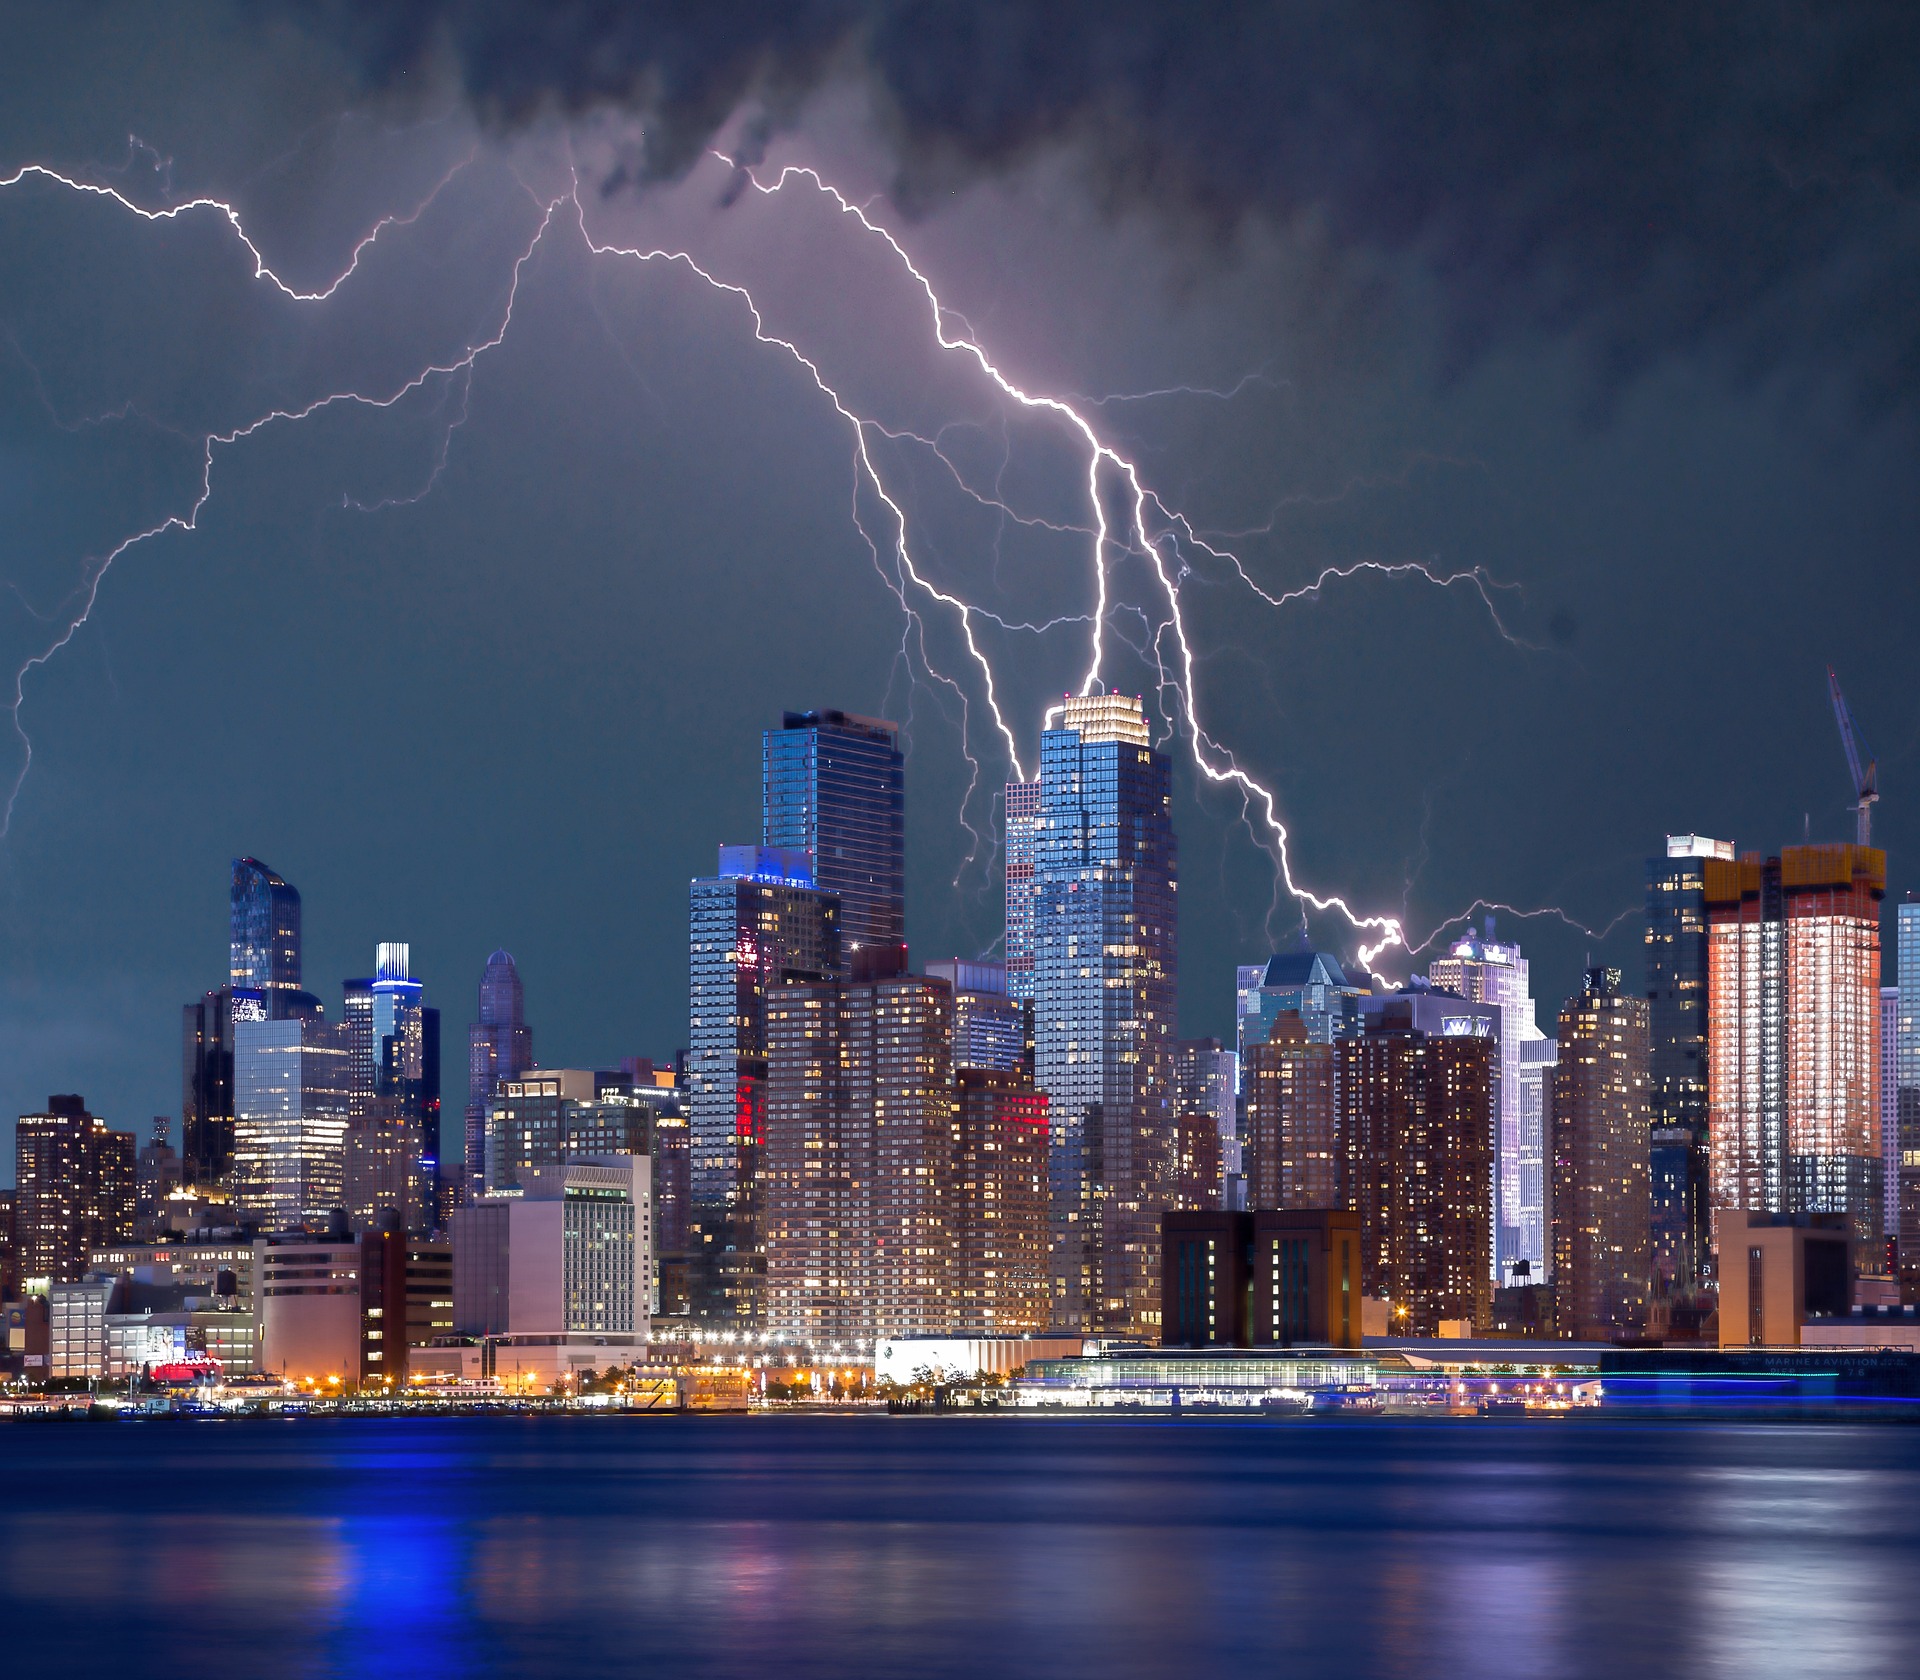
A thunderstorm in New York City. (Photo: Kevin Phillips / Pixabay)
The announcement, earlier this month, that tens of millions of euros will be invested in atmospheric research in a new consortium and research platform called the Ruisdael Observatory – named after the 17th century painter Jacob Ruisdael – was good news for Ricardo Reinoso and his colleagues at the Geoscience and Remote Sensing department. In a recent interview in Delta, the Head of this group and lead manager of the Ruisdael Observatory, Prof. Herman Russchenberg, estimated that about 70 million euros will be invested in the programme over the course of the next ten years.
These monies will be granted by the government’s science funding organisation, the NWO, and by the universities and institutions involved. These include the Royal Netherlands Meteorological Institute (KNMI), Utrecht University, the University of Groningen, VU Amsterdam, Wageningen University & Research, RIVM, TNO, ECN and TU Delft (coordinating university).
Weather radars will improve our understanding of thunderstorms
The aim of the project is to develop a nationwide dense network of measuring points with high-resolution simulations and the necessary computing power in order to map out the changes in local weather, climate and air quality at a scale of 100 square metres. As part of the ten-year project, new radars will be bought and placed in the Cabauw Observatory and Rotterdam city. Weather radars are capable of improving our understanding of thunderstorms, including their initiation and evolution.
These radars will be relatively low cost, small X band weather radars. These radars emit short wavelengths of about three centimetres or less. There are several other bands. Take the more expensive 10 cm wavelength S-band radar for instance. The S-band pulses are attenuated more slowly. Yet by deploying many small low-cost X-band radars, the hope is that a high-resolution image can be created in urban environments.
“This is extremely important,” says Reinoso. “Water drainage can be a problem in cities during heavy precipitation. The locations with heavy rainfall can be very specific. There might be heavy rain or hail here at the faculty building of Civil Engineering, and no precipitation at all at the Aerospace faculty, for instance. More fine-grained weather prediction can be helpful for urban water managers to manage water drainage.”
Between each pulse, the radar station serves as a receiver as it listens for return signals from particles in the air. The signals need thorough processing. And this is where Reinoso’s work comes into play. For his PhD thesis, which he will defend this summer (in September), the Delft PhD Student developed algorithms that filter out the noise.
‘Flocks of birds can distort the image of the atmosphere’
“There are heaps of disturbing noise sources. Flocks of birds can distort the image of the atmosphere, and so can airplanes, windmills and tall buildings, to name a few,” says the researcher, whose thesis is entitled ‘Advanced techniques to process differential phase measurements for polarimetric X-band weather radars’.
To obtain high definition images of clouds, rain, and hail, and tackle the problem of image disturbance, Reinoso works on a technique where the radars emit two pulses simultaneously with orthogonal polarisation (vertical and horizontal), which in turn generate two independent sets of data allowing for more efficient noise filtration.
These signals can be compared in several handy ways. Take the differential reflectivity. This is the ratio of the reflected vertical and horizontal power returns. This is a good indicator of drop shape, and drop shape is a good estimate of average drop size. “Falling droplets tend to have a larger horizontal axis due to the drag coefficient of air,” says Reinoso. “They sort of take the shape of a hamburger. From their shape we can deduct their size and speed.”
Do you have a question or comment about this article?
tomas.vandijk@tudelft.nl


Comments are closed.