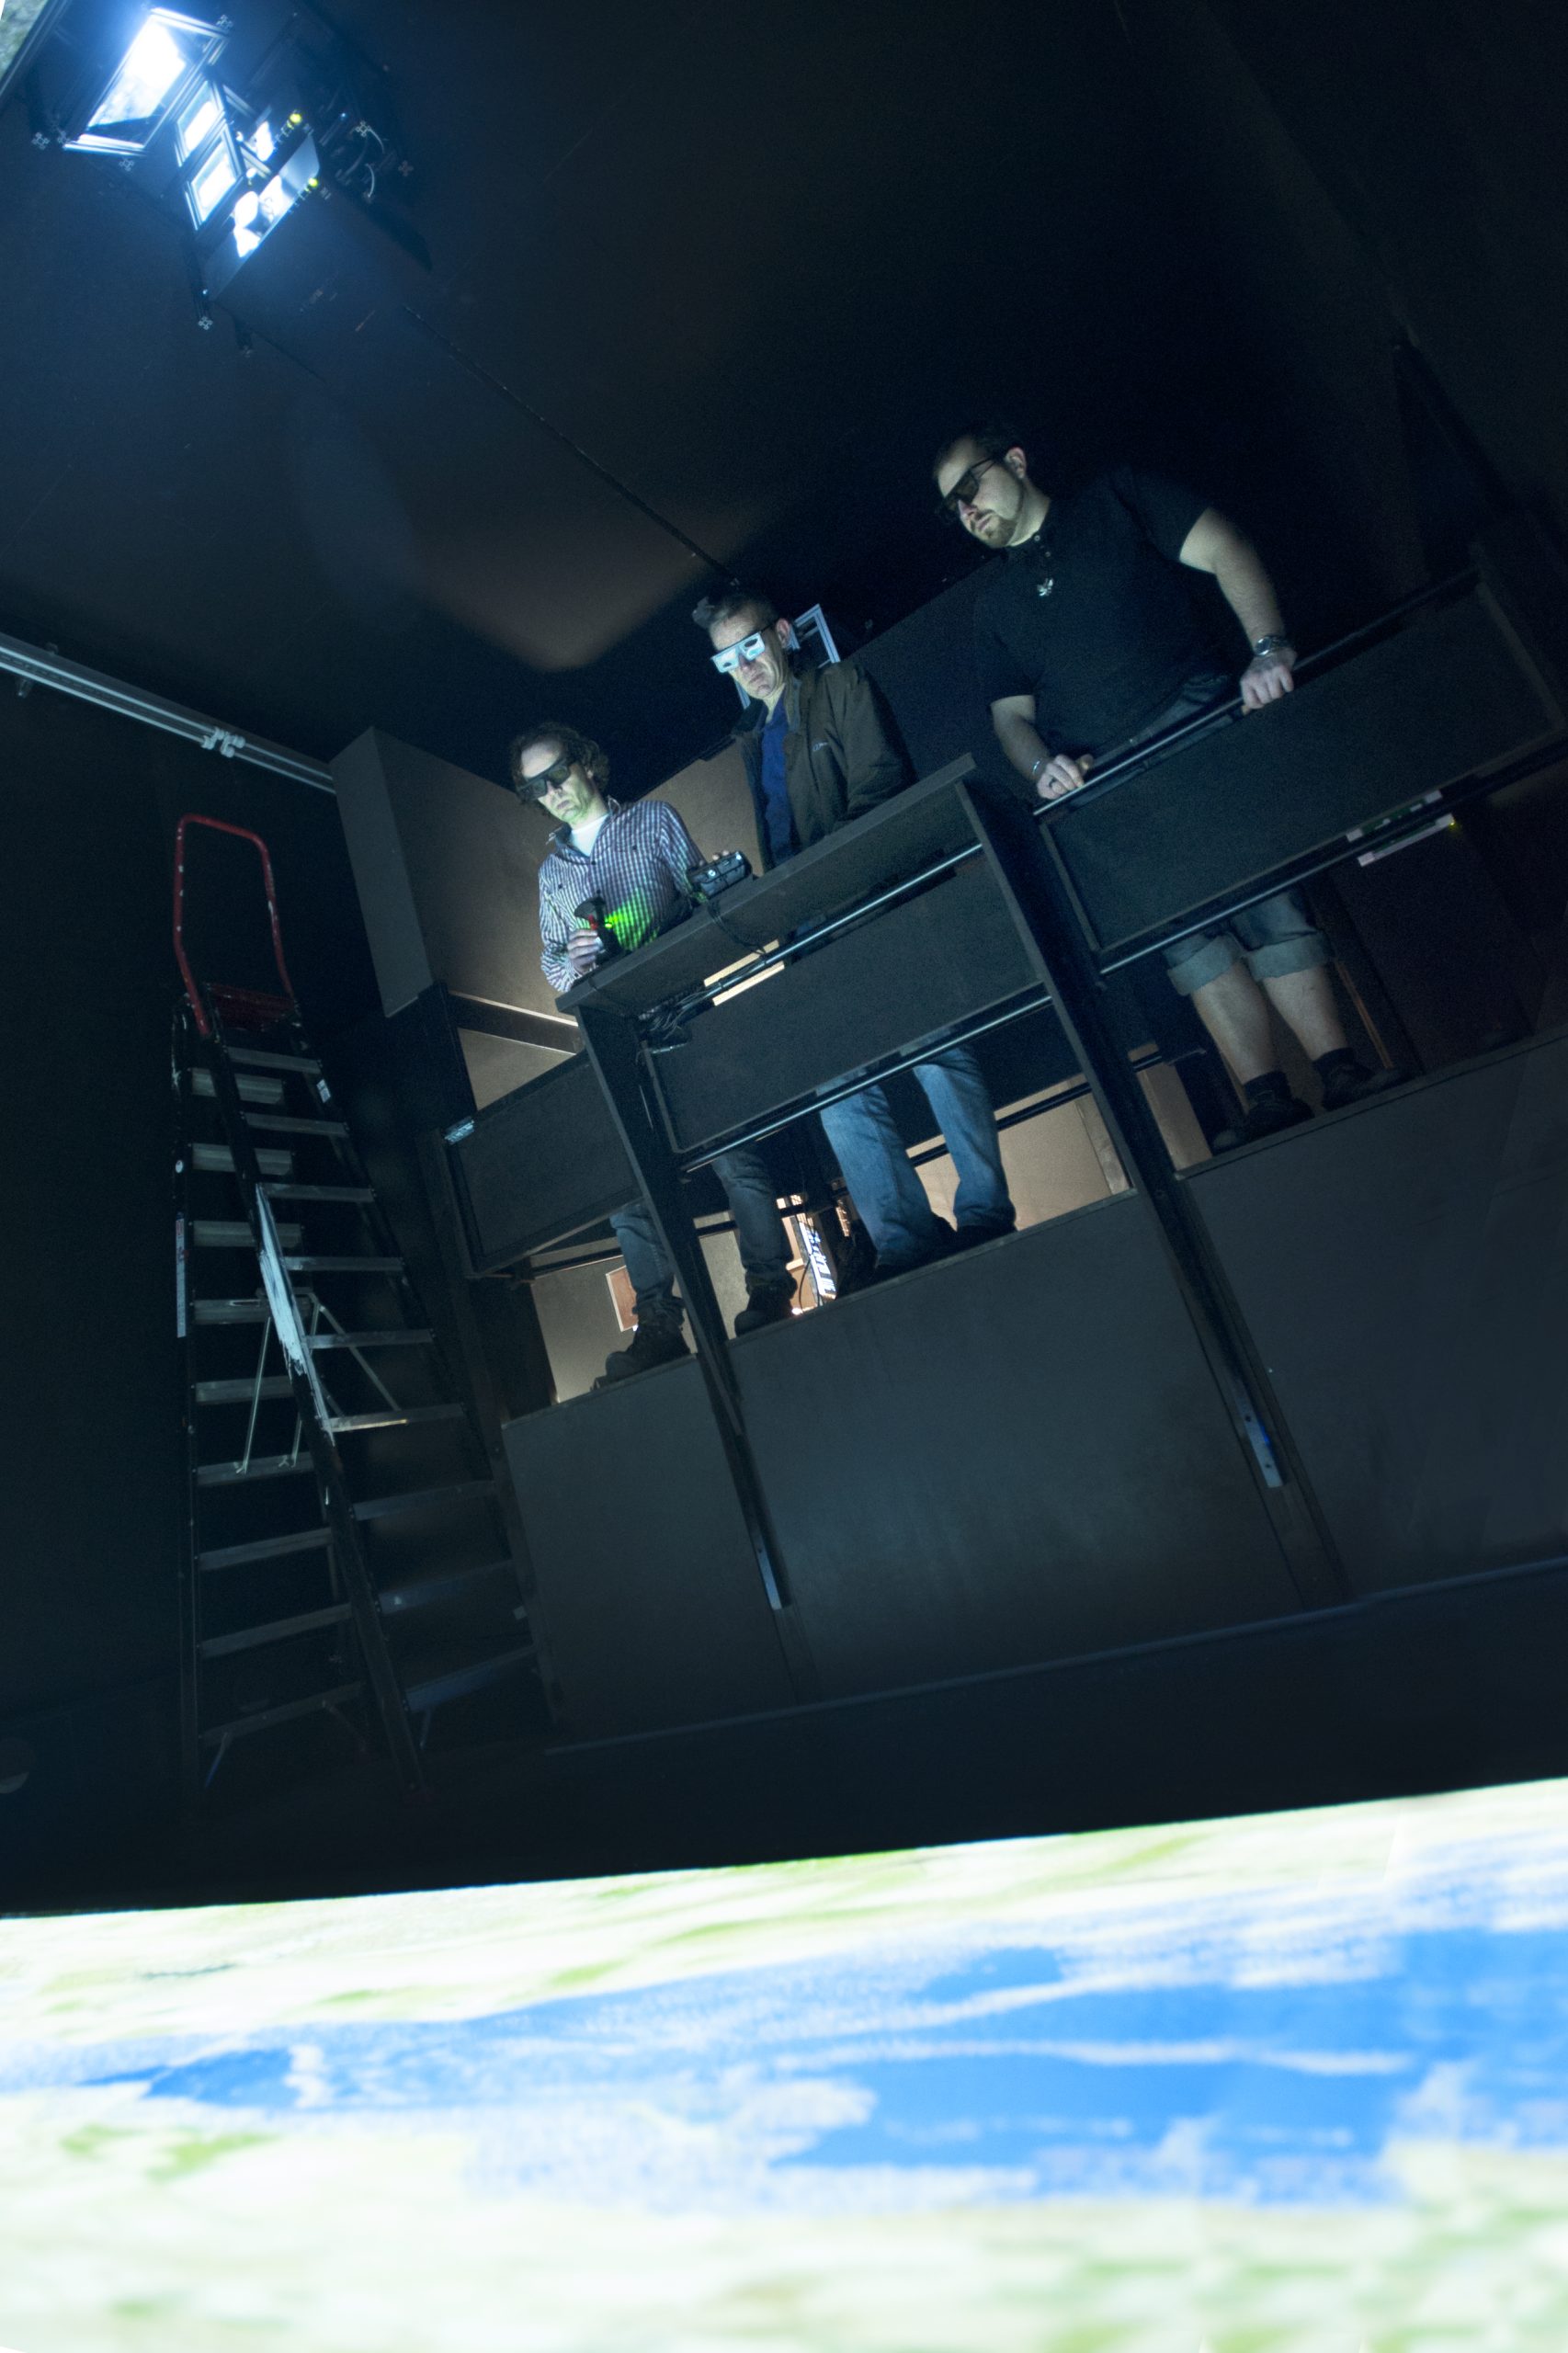
Sixty years after the infamous flooding of 3 February 1953, visitors to the TU Science Centre can interactively inspect the measure of the disaster.
Researchers of the TU combined the latest in 3D computer graphics, geo-informatics and hydrodynamics into a flooded landscape over which the visitors can fly using two controls. What they see (through their stereo glasses) is very much like what airmen must have seen on the first rescue missions.
Dr. Olivier Hoes (CEG faculty) made an inventory of all known breaches in the dikes including their time of origin, their width and depth. He combined this with data on the water height during the storm, and eyewitness reports to calculate how the polders must have flooded. “For example when I heard that Sunday morning around twelve (six hours after the dikes broke, Ed.), the water reached the village of Kerkwerve, I used that information to fine tune the flooding model”, Hoes explains.
Besides information on the broken dikes, he also needed exact heights of the polders, canals and ridges behind the dikes. He got this information from a 3D data cloud that has been collected by countless helicopter flights over the Netherlands. Zeeland was added to this 3D map (called AHN2) in 2007.
Hoes worked together with Christian Kehl Msc from visualisation and computer graphics (EEMCS faculty) to transform his data at the height of the flooding into interactive 3D graphics.
The result is stunning. Clouds reflect in the tranquil waters, waves are swept up over open areas and extinguish over the beaches. Lines of trees suggest where the roads must lie and some villages consist of no more than groups and rows of roofs surrounded by water.
What the display doesn’t show, but what Hoes explains, is that it took surprisingly long for the water to empty out. Some polders were flooded until November, so more than half a year later. “Meanwhile the water moved in and out with the tide, eroding the dikes further and further.”
The interactive display is a fitting commemorate of the worst flooding that hit the Netherlands. Few visitors will remark that the map doesn’t correspond to Zeeland of 60 years ago. Instead, the display shows present day Netherlands as if it were hit by the 1953 flooding. A thought that is somewhat haunting.
→ The exhibition in the Science Centre is open to the public from 1 February. The opening is on Wednesday before.


Comments are closed.